Wednesday, May 29, 2013

Experiment 17: Planck's Constant

Purpose: To experimentally determine Planck's constant using the diffraction method and LED lights.

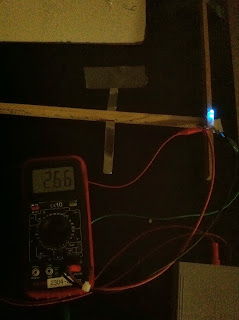
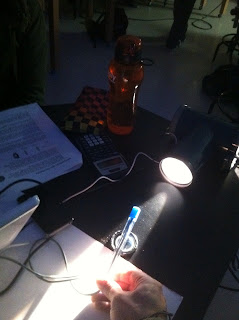
Set Up: Just as in the hydrogen spectra lab, we measured the light spectra through a diffraction grating for a red, yellow, blue, and green LED.

Yellow:


Blue:


Green:


Red:


White:


Then we calculated the wavelength associated with each color and recorded the voltage across each LED.


Data:

d 2.00E-06
Yellow Red Blue Green
Length (m) 1.80 1.80 1.80 1.80
Voltage (V) 1.914 1.907 2.660 2.830
Gap 1 0.5233 0.5587 0.4727 0.5133
Gap 2 0.5453 0.5713 0.4706 0.5152
Gap 3 0.5333 0.5883 0.4705 0.5030
Average 0.5339 0.5727 0.4713 0.5105
Lambda 5.687E-07 6.064E-07 5.065E-07 5.457E-07
eV 3.062E-19 3.051E-19 4.256E-19 4.528E-19
C/eV 9.796E+26 9.832E+26 7.049E+26 6.625E+26
h 5.806E-34 6.168E-34 7.186E-34 8.236E-34
average h 6.849E-34

We can rewrite E = hf    as     lamba = hc/E and the slope is the value for h.


Conclusion: The value we obtained for h is 2E-34 which has percent error of 70.43% to the actual value measured to be 6.626E-34. The error can be contributed to the strange voltage we measured for the blue LED.

Experiment 16: Color and Spectra

Purpose: To observe the color spectra of white light and to measure the wavelengths of several different colors. We will investigate light spectra further by measuring wavelength of light emitted by a hydrogen tube.

Materials:

  • discharge tube
  • power supply
  • incandescent lamp
  • meter sticks
  • markers
  • diffraction grating
  • grafting holder
  • hydrogen tube
Set Up:

The wavelength measuring apparatus is set up as shown. Two rulers are set up making a right angle at the light source. A person can view the light spectrum through the diffraction grating. We can measure the wavelength by marking the beginning and end of the spectrum on the ruler.


Experiment:


First we calculated the average wavelength and standard deviation of the true values of the spectra found by other experimentalists.

Then we measured the values ourselves by looking through the diffraction grating and marking the beginning and end of the spectrum. Each trial was measured by a different person.


Now we could calibrate our equation for viewing of the hydrogen spectra


Our calibrated equation is y = 1.0699 x - 58.43

After obtaining measurements for the hydrogen gas spectra we can plug the values into this equation.


For the purple wavelength we calculated the value to be 381.3 +- 12.5 nm. The actual value from the Balmer series is 410. Substitute into the calibration equation and get 380.23 nm

For the blue wavelength we calculated the value to be 449.8 +- 15.0 nm. The actual value from the Balmer series is 486 nm. Substitute into the calibration equation and get 461.54 nm

For the red wavelength we calculated the value to be 622.0 +- 5.5 nm. The actual value from the Balmer series is 656 nm. Substitute into the calibration equation and get 643.42 nm

Conclusion: Based off these measurements are percent error for the purple wavelength was 0.28%, 2.54% for blue wavelength, and 3.33% for red wavelength. These measurements are therefore fairly accurate.


Experiment 15: Potential Energy Diagrams and Potential Wells

Potential Energy Diagrams:
Inline image 1

 1.       The range of motion is between -5 and 5 cm.

2. The particle does not have enough kinetic energy to pass through that boundary.

3.     There is a higher probability of finding the particle from -5 to 0 cm because it has a higher potential energy on that side.

Inline image 2

4.      The range of motion increases when the energy is doubled.

Inline image 3

5.    The graph is an inverted parabola.

Inline image 4

6.    The particles will be most likely found at the ends where the boundaries are located.

Inline image 5

Potential Wells:

1. E = 2.1 * 10^6 eV
 Inline image 6

2. 4(2.1MeV) = 8.4 MeV for infinite well but not for finite well

3. In the infinite well it is has larger energy in its first excited state because it has a shorter wavelength than in the finite well

4.
Inline image 7

When the potential energy is decreased, the total energy of the n = 3 state decreases as well because the U(x) function decreases the area the particle can be in and the wavelength decreases.

5.
Inline image 8

The penetration depth decreases as the mass increases. This is because the mass is becoming measurable and cannot travel in to the forbidden region. 

Tuesday, May 28, 2013

Experiment 14: Relativity of Length

Relativity of Length Activity

Inline image 4

Question 1: Yes. The movement changes the observed distance.

Question 2: Longer due to time dilation.

Question 3: Yes. It must in order to withhold the Lorentz factor relationship.

Question 4: It would be 769.23 meters while moving.

Experiment 13: Relativity of Time

Relativity of Time Activity

Inline image 1


Question 1: The distance is greater for the moving frame than for the stationary one.

Inline image 2


Question 2: The moving frame will experience a longer time interval.

Inline image 3

Question 3: No, the rider would experience the same result as the stationary frame because it is the equivalent of a stationary frame of reference.

Question 4: There would be less of a difference in time experienced if the velocity was decreased because the distance the light traveled in the moving frame of reference would decrease.

Question 5: It would be the time measured by the observer riding the light clock multiplied by the Lorentz factor. in this case it is 8x10^-6 seconds for a time of 6.67x10^-6 and a Lorentz factor of 1.2.

Question 6: The Lorentz factor would have to be 1.1169

Experiment 12: Polarization of Light

Purpose: Observe the change in light intensity of light as it passes through polarized filters.

Materials:
  • computer
  • light sensor
  • LabPro
  • Logger Pro
  • light source
  • polarizing filters
  • protractor
Set Up:


Preliminary Questions:
1. When the axis marks are at tight angles to each other, very little light can get through the filters.

2. When they are parallel the intensity is at its maximum.

2 Polarizers Data:
Angle (o) Intensity Counter Clockwise(lux) Intensity Clockwise(lux) Average Intensity (lux) I/Imax cos2θ
0 325.517 324.223 324.870 1.000 1.000
15 220.165 236.994 228.579 0.704 0.933
30 174.619 176.575 175.597 0.541 0.750
45 115.546 117.860 116.703 0.359 0.500
60 72.517 74.718 73.618 0.227 0.250
75 51.322 50.376 50.849 0.157 0.067
90 35.165 36.821 35.993 0.111 0.000
105 92.148 91.407 91.777 0.283 0.067
120 164.268 165.100 164.684 0.507 0.250
135 231.547 232.313 231.930 0.714 0.500
150 304.157 305.323 304.740 0.938 0.750
165 317.149 319.576 318.362 0.980 0.933
180 329.157 327.669 328.413 1.011 1.000


Intensity vs. Angle for clockwise motion


Intensity vs. Angle for counterclockwise motion


Average Intensity vs. Angle


Average Intensity vs. Cos^2(theta)

When the polarizers are parallel to one another the intensity is at the minimum. When they are parallel, the intensity is at a maximum.

3 Polarizers Data:


When the second polarizer is at 0 or rotated 90 degrees, then it become perpendicular to both the first and third polarizers which results in minimal intensity. When the second polarizer is rotated 45 degrees, then half of the light from the first polarizer makes it through the filter. That in turn gets passed through the third filter at half the intensity which is the highest intensity this apparatus can reach.


Polarization upon Reflection:
1. No, the fluorescent bulb does not have polarization to it.

2.Yes, the reflected light does have polarization. It is polarized in the plane perpendicular to the table because when we turn the filter parallel to the table, no light passes through the filter.

Conclusion: The labs results are consistent with the calculations.

Experiment 10: Measuring a Human Hair

Purpose:  Use a laser pointer  to give an approximation of how thick a human hair is and then use a micrometer to verify our calculations

Materials:
  • 3X5 card with hole in it
  • single strand of hair
  • ruler
  • laser pointer
  • micrometer
Set Up:

A red laser with wavelength of 660 nm was aimed through the notecard with a hole in it at a white board.


 The hair acts as a diffraction grating, dividing the laser point into multiple minima and maxima.


 Data/ Calculations:

This is the calculation of the width of the hair since the hair acts as a diffraction grating.
y in the equation is the distance between the fist order maxima and the center dot
L is the distance from the notecard to the whiteboard.
and d is the diffraction grating/ thickness of the hair.

Then we tested our results by measuring the hair directly with a micrometer. This reading gave us
50 ± 20 μm

Conclusion: This experiment gave us a measurement that fell within uncertainty of our calculated value for the thickness of the human hair even though our percent error was found to be 65%.