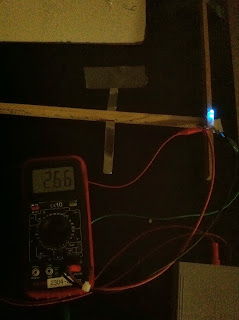
Set Up: Just as in the hydrogen spectra lab, we measured the light spectra through a diffraction grating for a red, yellow, blue, and green LED.
Yellow:
Blue:
Green:
Red:
White:
Then we calculated the wavelength associated with each color and recorded the voltage across each LED.
Data:
| d | 2.00E-06 | |||
| Yellow | Red | Blue | Green | |
| Length (m) | 1.80 | 1.80 | 1.80 | 1.80 |
| Voltage (V) | 1.914 | 1.907 | 2.660 | 2.830 |
| Gap 1 | 0.5233 | 0.5587 | 0.4727 | 0.5133 |
| Gap 2 | 0.5453 | 0.5713 | 0.4706 | 0.5152 |
| Gap 3 | 0.5333 | 0.5883 | 0.4705 | 0.5030 |
| Average | 0.5339 | 0.5727 | 0.4713 | 0.5105 |
| Lambda | 5.687E-07 | 6.064E-07 | 5.065E-07 | 5.457E-07 |
| eV | 3.062E-19 | 3.051E-19 | 4.256E-19 | 4.528E-19 |
| C/eV | 9.796E+26 | 9.832E+26 | 7.049E+26 | 6.625E+26 |
| h | 5.806E-34 | 6.168E-34 | 7.186E-34 | 8.236E-34 |
| average h | 6.849E-34 |
We can rewrite E = hf as lamba = hc/E and the slope is the value for h.
Conclusion: The value we obtained for h is 2E-34 which has percent error of 70.43% to the actual value measured to be 6.626E-34. The error can be contributed to the strange voltage we measured for the blue LED.


No comments:
Post a Comment